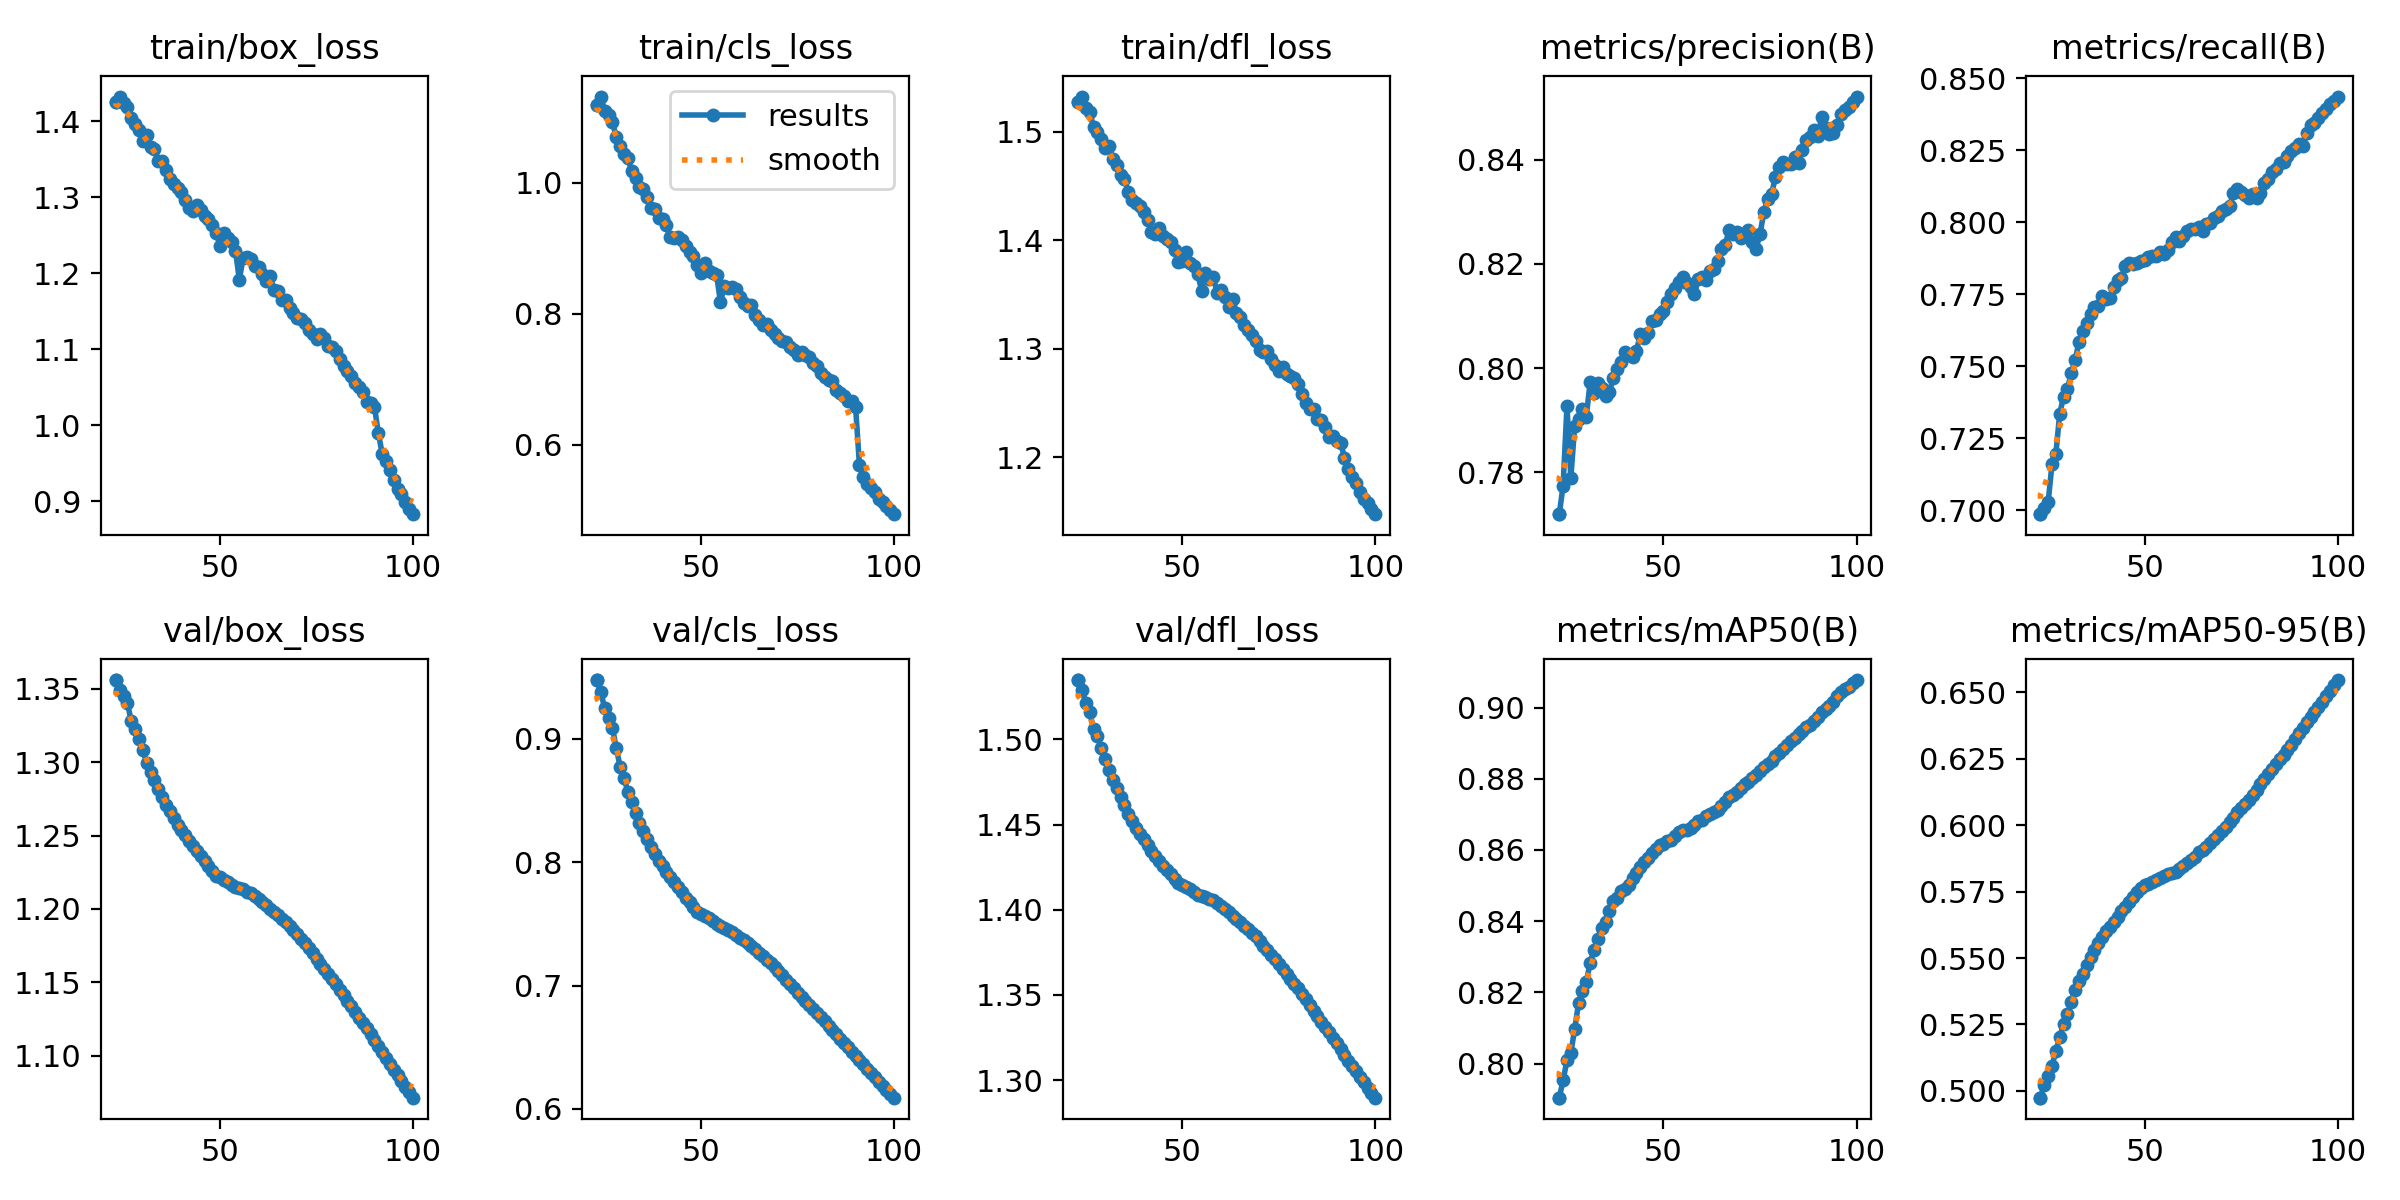
Training Results of YOLOv8-m on Rice Disease Dataset
YOLOv8-m Training Results
Confusion Matrix
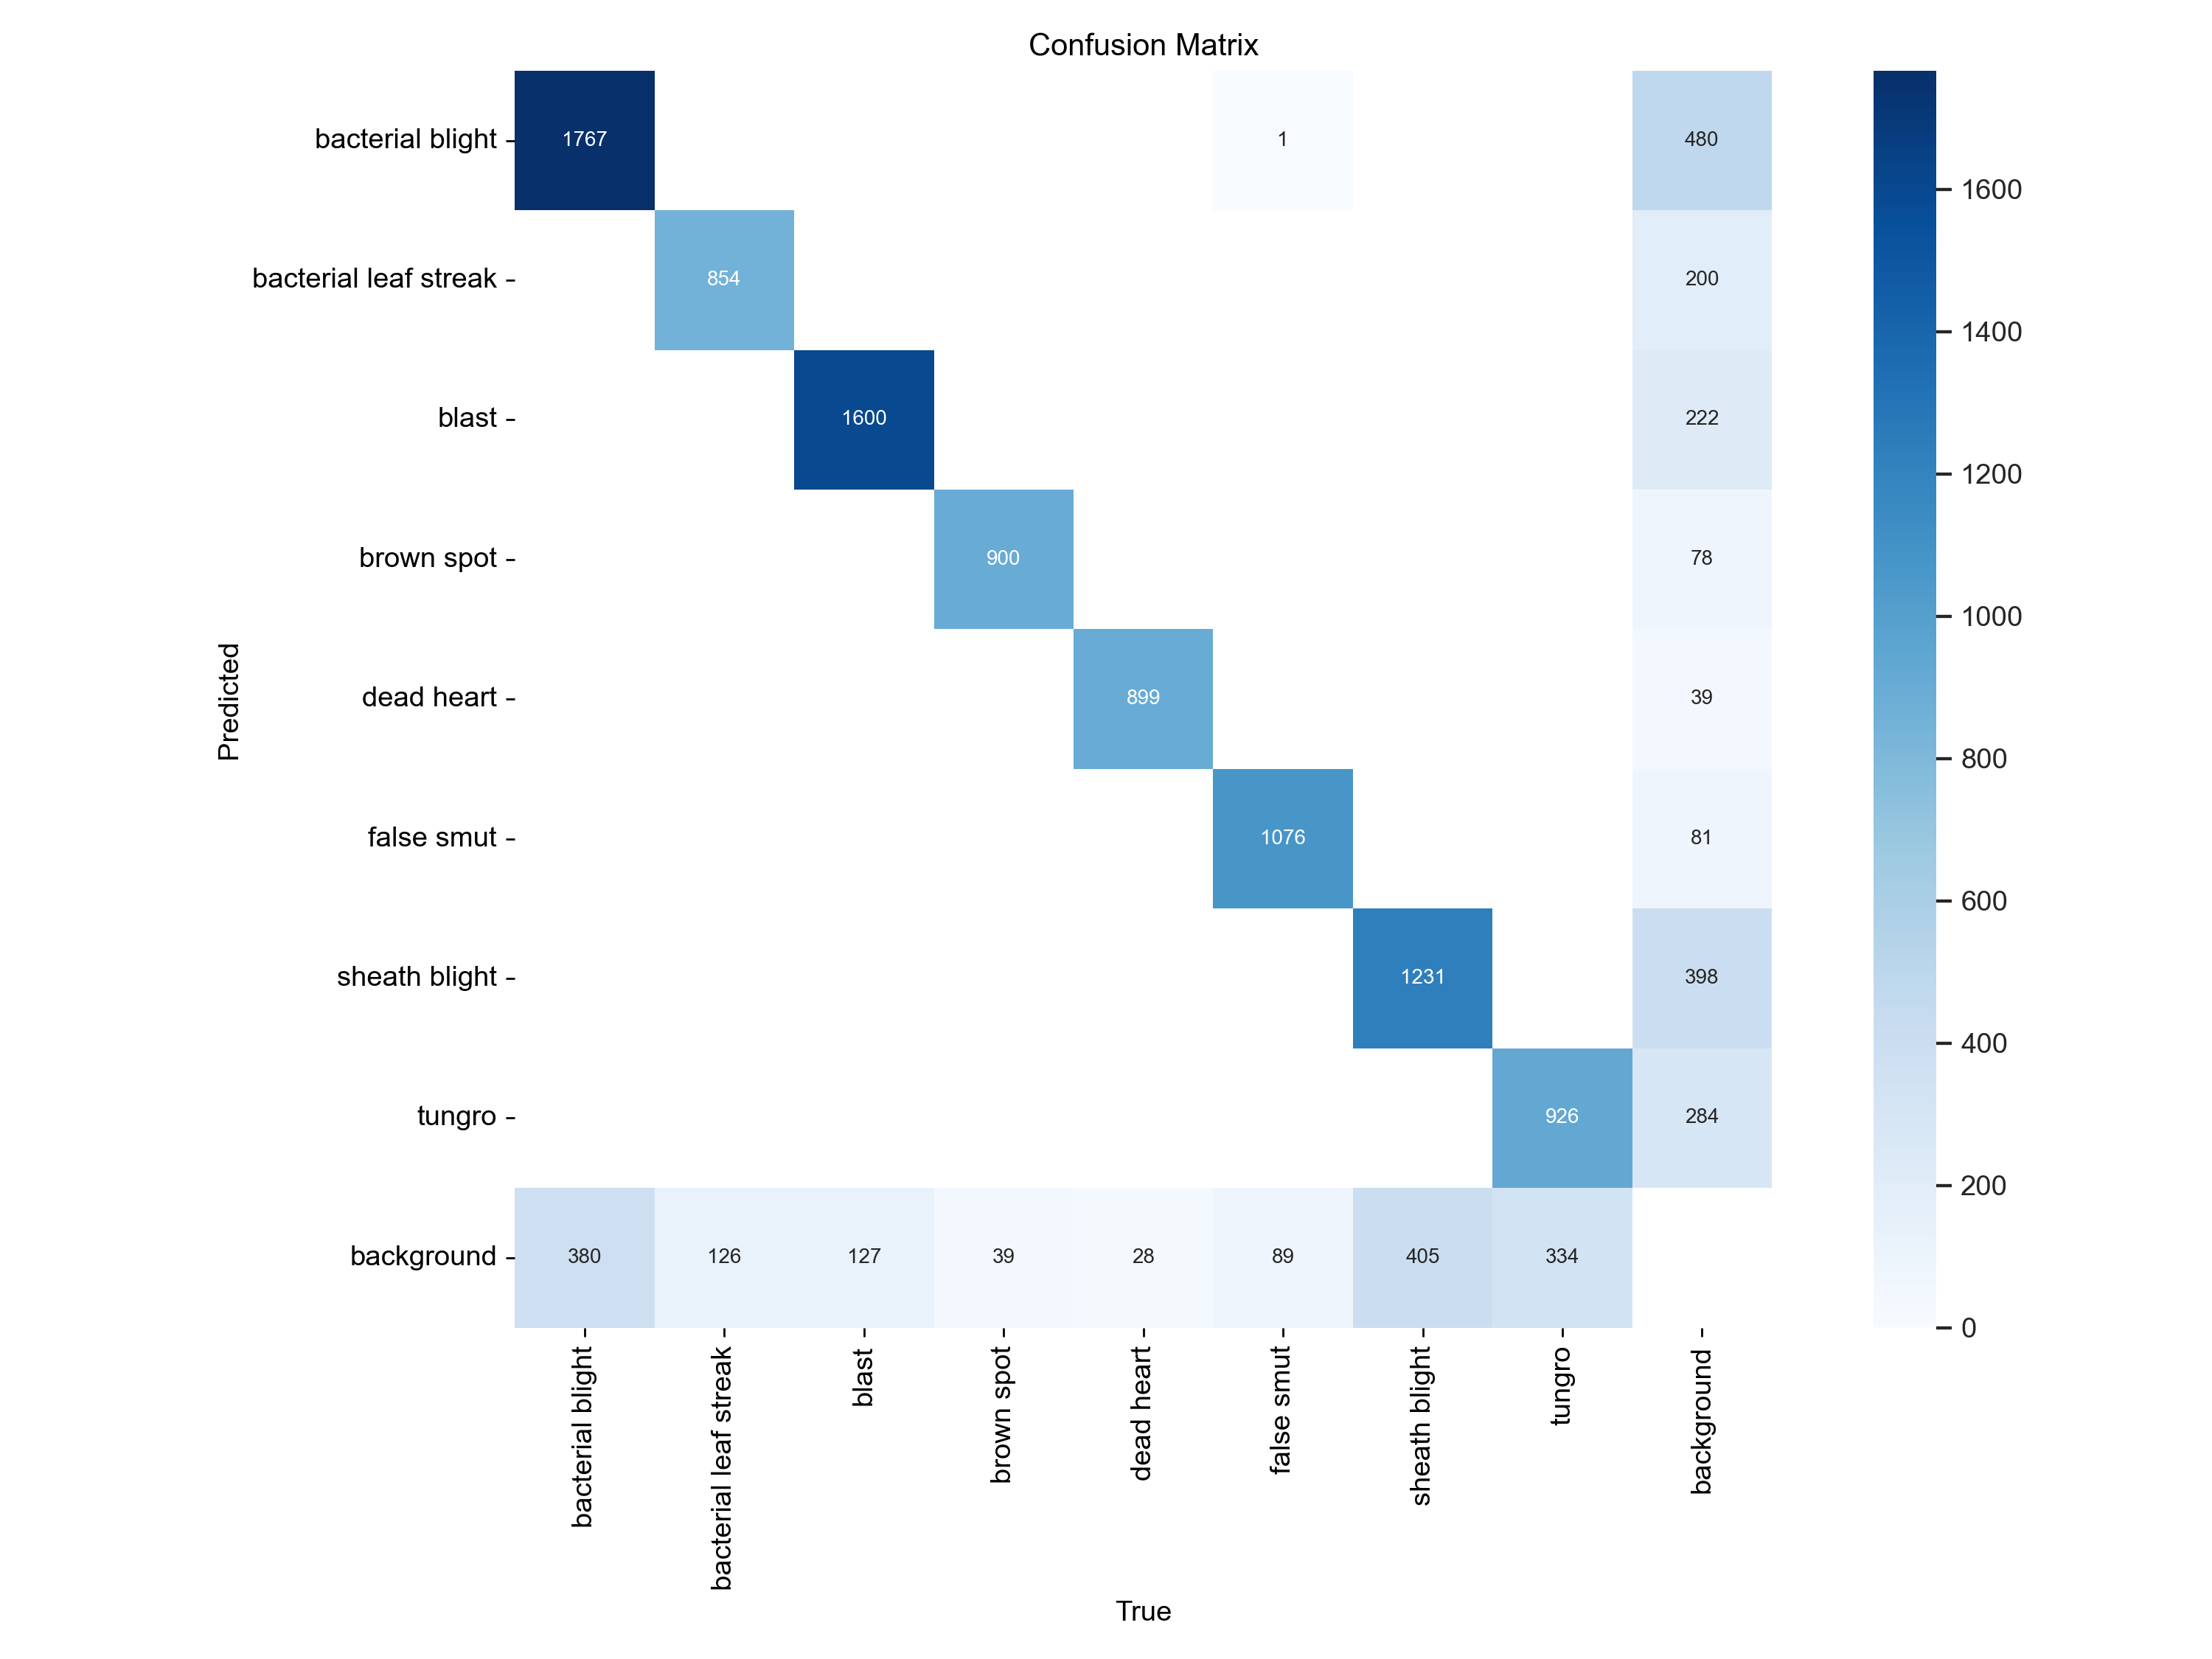
The confusion matrix for the YOLOv8m model after training shows strong performance in correctly
identifying various
plant diseases. The diagonal elements, representing true positives, indicate high accuracy for most
classes, such as
bacterial blight with 1767 correct predictions and tungro with 926 correct predictions. The matrix also
includes a row
and column for the background class, which represents instances where the model correctly identifies
that no disease is
present. High values along the diagonal for the background class indicate that the model is effectively
distinguishing
between diseased and non-diseased areas.
Conversely, off-diagonal values in the background row
or
column
would indicate
misclassifications, where the model either incorrectly labels background as a disease (false positive)
or fails to
detect a disease and labels it as background (false negative). The matrix shows instances where there
are
misclassifications of diseases incorrectly classified as background. Overall, the model demonstrates
robust
classification capabilities, though there is room for improvement in reducing misclassifications between
disease classes
Precision - Recall Curve
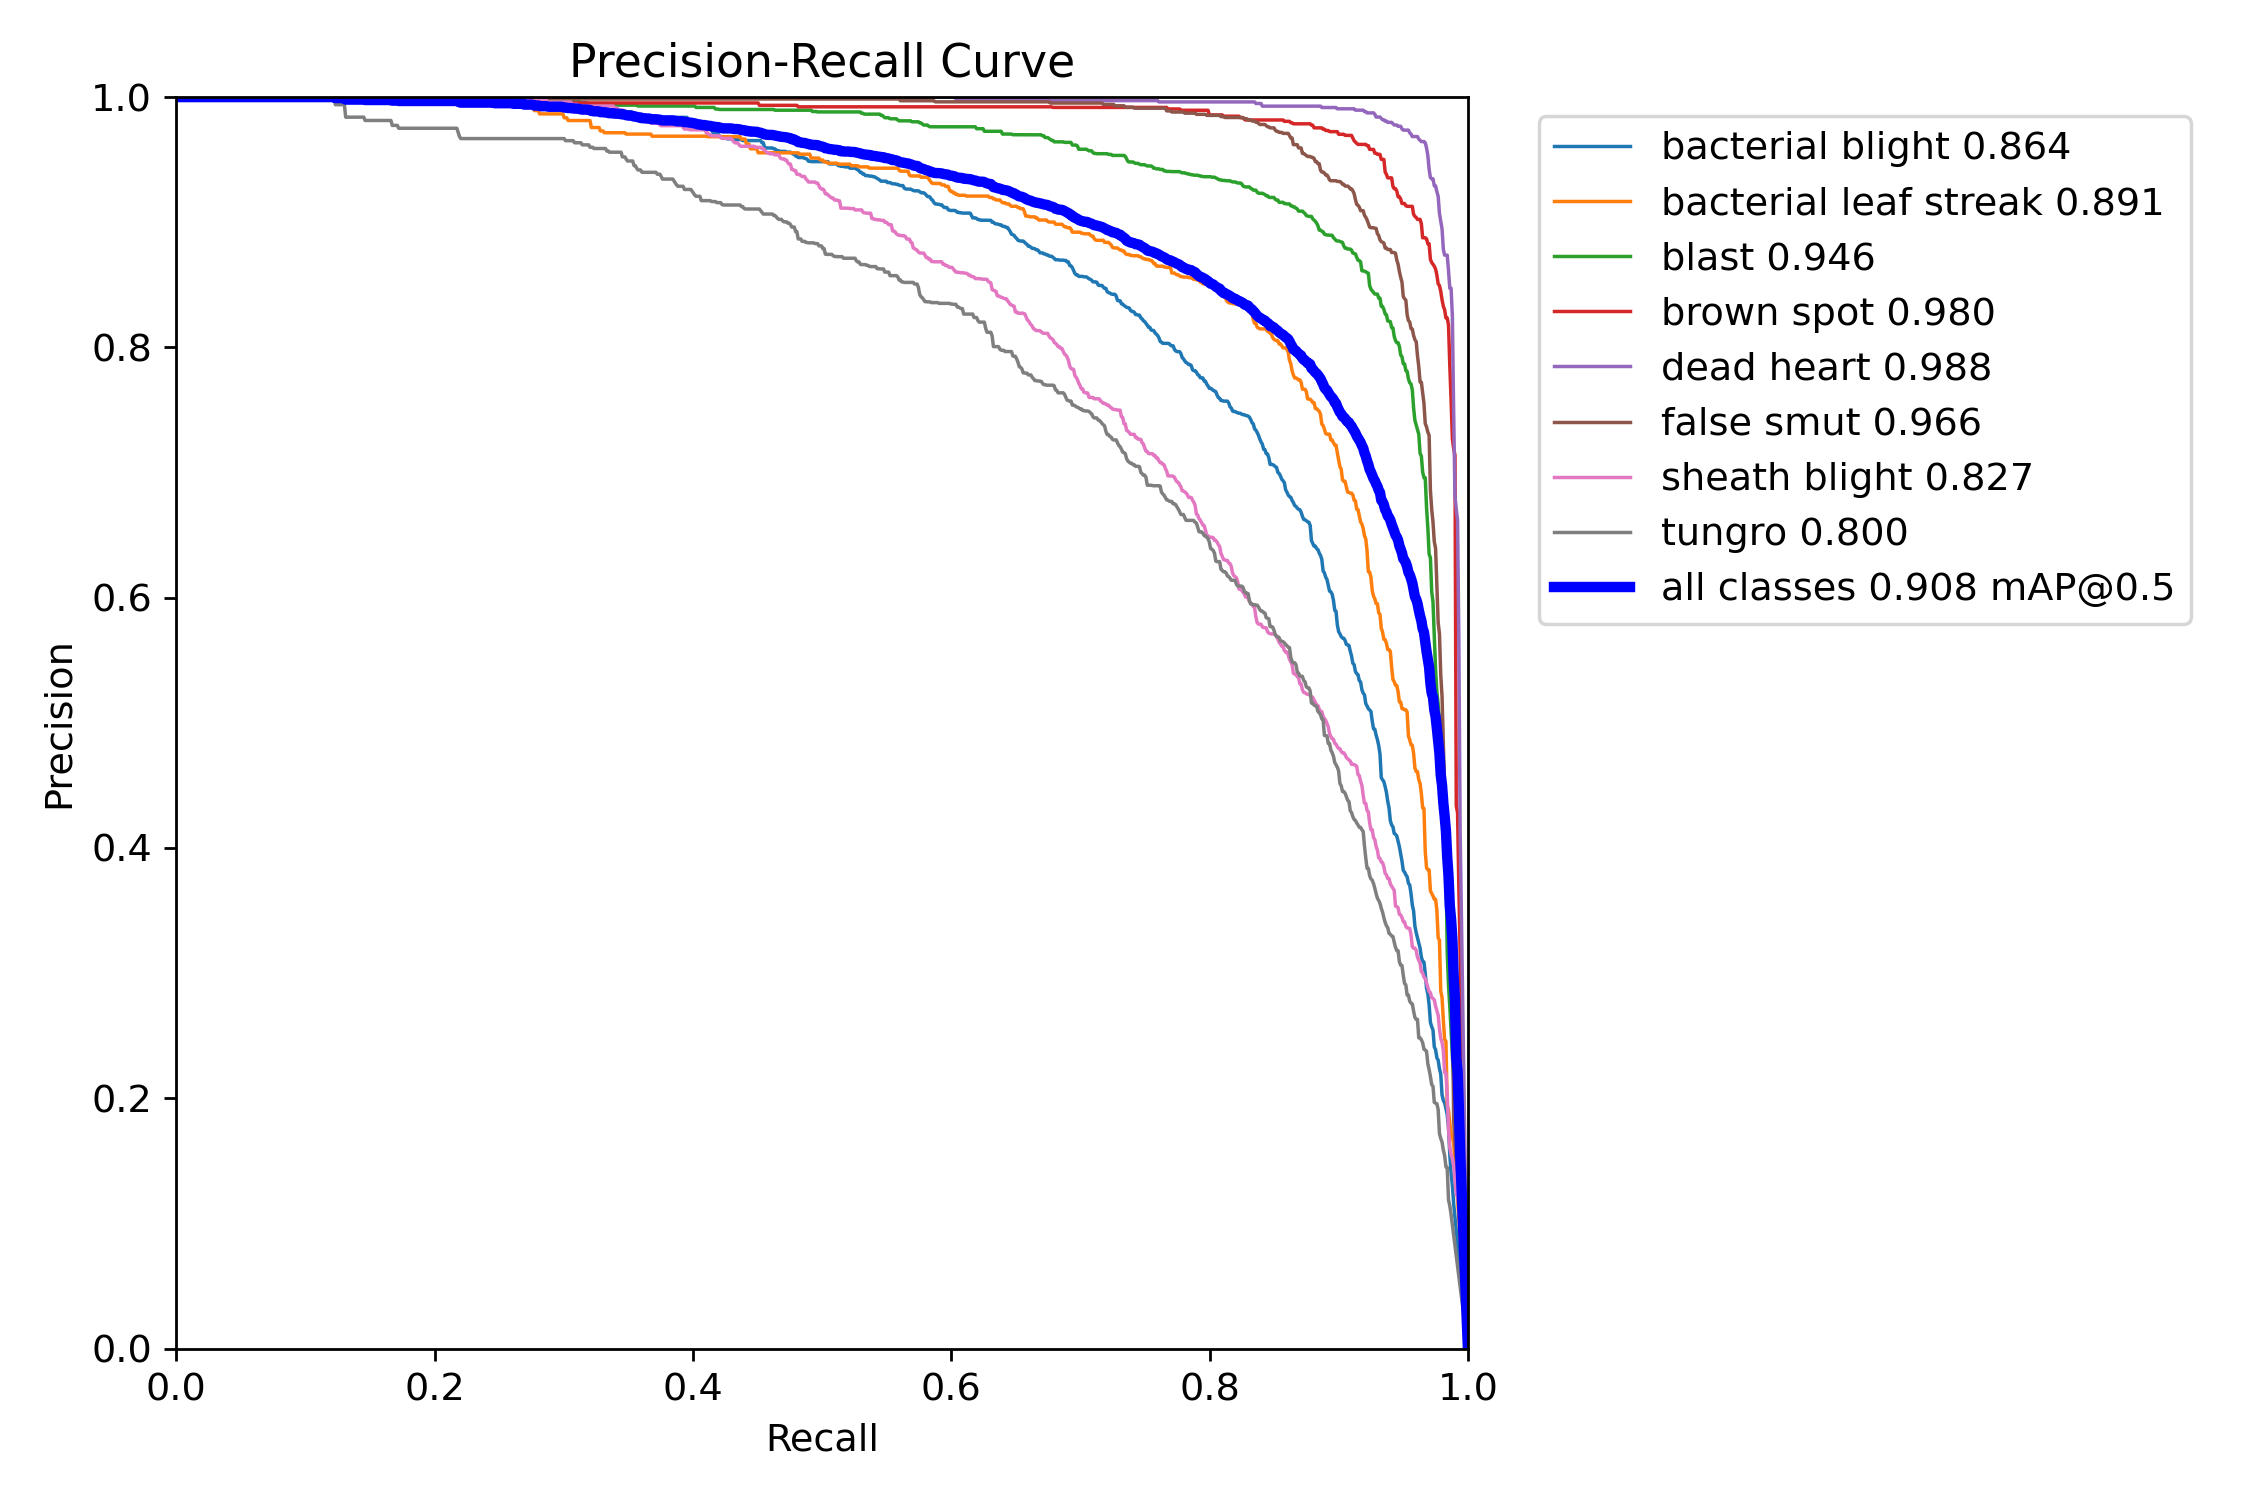
The precision-recall curve for the YOLOv8m model after training provides a detailed view of the model’s performance across different classes. Each curve represents a different class, showing how precision and recall trade off at various thresholds. The dark blue line represents the combined performance across all classes, with an overall mean average precision (mAP) of 0.908 at an IoU threshold of 0.5. This curve indicates that the model performs well across different classes, maintaining a good balance between precision and recall